Covid 19 - Mobility Index - Santiago
The first case of Covid 19 in Chile was registered on the 4th March 2020. Since then the virus has had a devastating impact with 349,900 confirmed cases and 9,240 confirmed deaths as of the date of this publication. Chile and especially its capital - Santiago has experienced extended periods of quarantine. Today the 28th June 2020, five comunas in the urban area of Santiago (La Reina, Ñuñoa, Vitacura, Las Condes, Lo Barnechea) will progress to the second phase of the deconfinement plan which is called Paso a Paso. Therefore, it is a good moment to review mobility data for Santiago to see how levels of mobility in the capital have changed in different periods of quarantine.
2) Packages
The following packages will be used in this publication.
library(knitr)
library(png)
library(readr)
library(dplyr)
library(lubridate)
library(ggplot2)
3) Data
Smart phone data has been used to create a mobility index. The index is calculated with the number of journeys divided between the number of smart phones registered. A journey is registered when a smartphone interacts with an antena in the telephone network and then also interacts with a second antena in the network but in a different location.
The data can be downloaded from the github account of the Chilean Ministry of Health.
The data is downloaded and then filtered to only included the comunas in the urban area of Santiago. From now the urban area will be referred to as Santiago.
MobilityIndex <- read_csv("~/Documents/Machine Learning/15. Hugo/academic-kickstart-master/content/en/post/MobilityIndex/IndiceDeMovilidad.csv")

Santiago_Comunas <- c("Cerrillos", "Cerro Navia", "Conchalí", "El Bosque", "Estación Central", "Huechuraba", "Independencia", "La Cisterna", "La Florida", "La Granja", "La Pintana", "La Reina", "Las Condes", "Lo Barnechea", "Lo Espejo", "Lo Prado", "Macul", "Maipú", "Ñuñoa", "Pedro Aguirre Cerda", "Peñalolén", "Providencia", "Pudahuel", "Quilicura", "Quinta Normal", "Recoleta", "Renca", "San Joaquín", "San Miguel", "San Ramón", "Santiago", "Vitacura", "San Bernado", "Puente Alto")

Santiago <- MobilityIndex %>% filter(Region == 'Metropolitana de Santiago' & Comuna %in% Santiago_Comunas)
4) Feature Engineering
The mobility index is calculated for all of Santiago.
MI_aggregated_RM <- aggregate(IM~Fecha, data = Santiago, FUN = "sum")New variables are created for the day of the week and if it is a weekend or not.
MI_aggregated_RM$Day <- wday(MI_aggregated_RM$Fecha, label = T)

MI_aggregated_RM$Weekend <- if_else(MI_aggregated_RM$Day %in% c("Mon", "Tue", "Wed", "Thu", "Fri"), "Weekday", "Weekend")
If the data is displayed graphically it is shown that the mobility has varied throughout the study period of February to July. There was a reduction at the end of March. However, it seems that since April the mobility has not only reduced. There have been periods of fluctuation with increases and reductions.
ggplot(data = MI_aggregated_RM) + geom_point(aes(x = Fecha, y = IM, color = Weekend))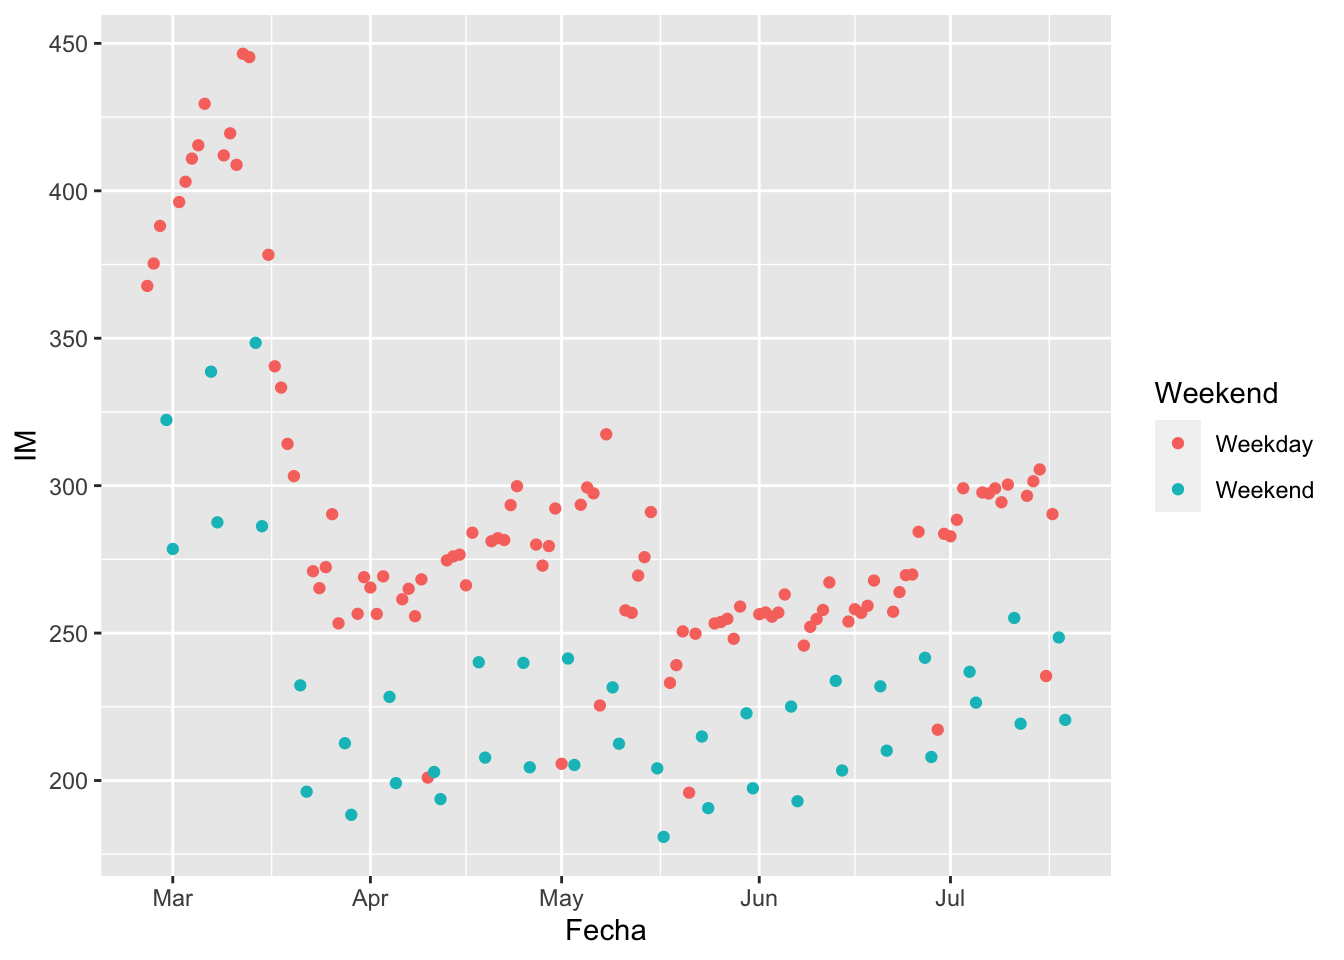
4.1) Geom_rect and National Holidays
As there have been fluctuations in the mobility index, a geom_rect layer will be added to the graph to show in which periods there were quarantine. Additionally, a new variable will be added to show which days were national holidays, as on these days a reduction in mobility is likely.
rects <- data.frame(xstart = seq(as.Date("2020-02-26"), as.Date("2020-07-18"), "day"),
                    xend=seq(as.Date("2020-02-27"), as.Date("2020-07-19"), "day"), color = seq(1,144,1))

rects$Quarantine <- if_else(rects$color >= 80, "QuarantineTotal", if_else(rects$color %in% c(30:80), "QuarantinePartial", "NoQuarantine"))

rects$Holidays <- if_else(rects$color %in% c(45,46,66,86,125,142), "Holiday", "NoHoliday")


MI_aggregated_RM$Holidays <- if_else(MI_aggregated_RM$Fecha %in% as.Date(c("2020-04-10", "2020-04-11", "2020-05-01", "2020-05-21",
                                                 "2020-06-29", "2020-07-16")), "Holiday", "No")
5) Graph and Analysis
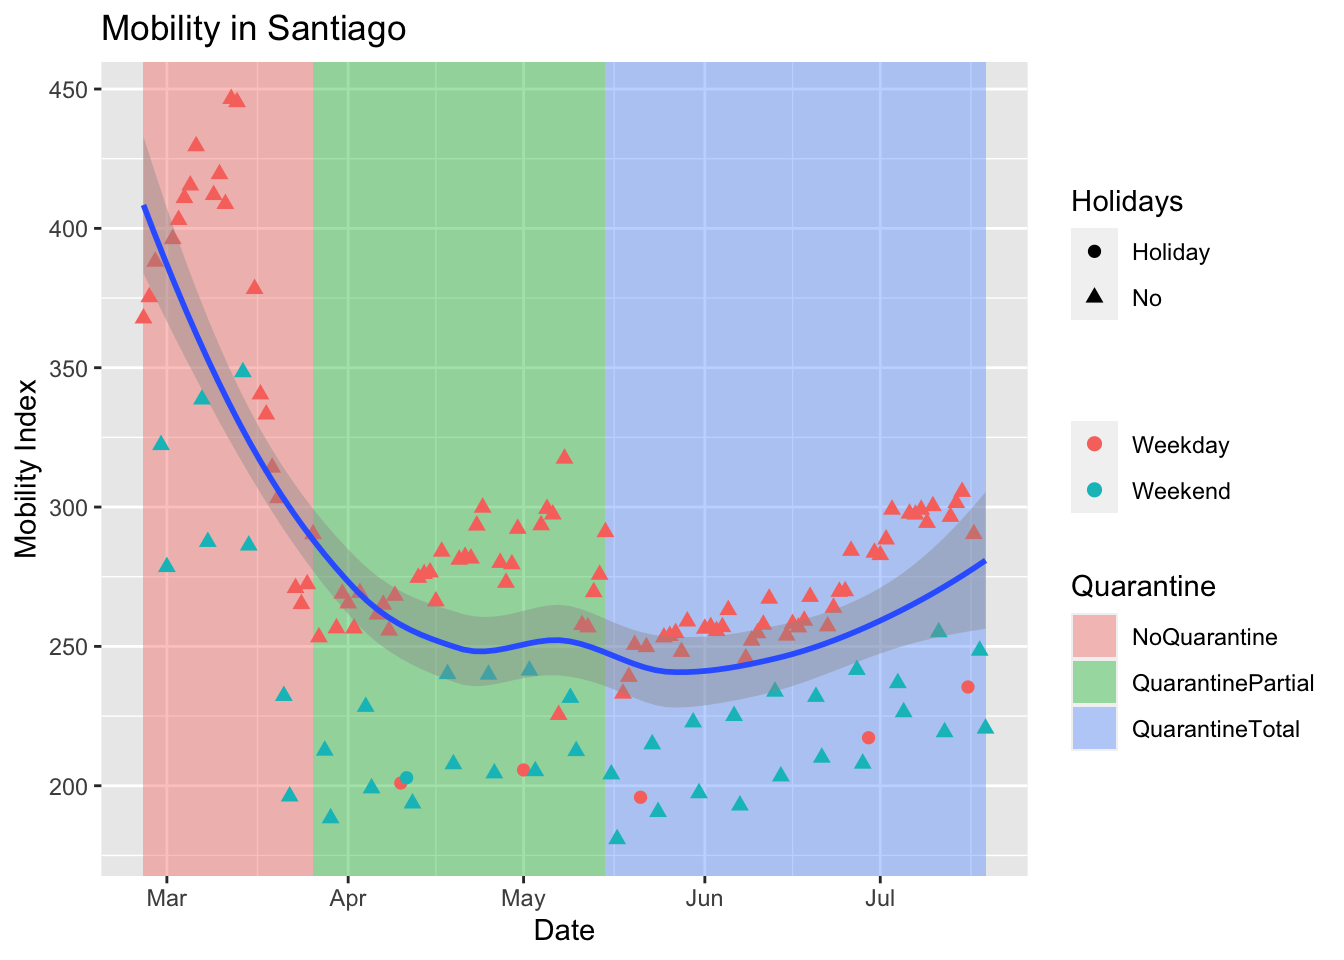
In the below graph the mobility index for Santiago since March 2020 is shown, with periods of quarantine, national holidays, and weekends identified.
The general trend is that there has been a reduction in mobility, however as the quarantine has continued the mobility has increased.
Santiago has had a dynamic quarantine policy with the declaration of quarantine at the comuna level. This is to say that in any moment certain comunas have been in quarantine whilst others have been functioning normally. Despite this, the different quarantines can be put into two groups:
Partial - period since the first quarantine of six comunas declared on the 26th March 2020.
Total - period since the declaration of full quarantine in Santiago on the 15th May 2020.
With these periods of quarantine added to the graph, the fluctuations in mobility make more sense.
When the partial quarantine was declared the mobility had already reduced from the levels registered in the middle of March. This reduction, to level of between 250 - 270, was maintained until the middle of April. However between the middle of April and the middle of May the mobility increased with a peak of 317 on the 8th May.
This increase could be due to a combination of factors:
Dynamic quarantines - with varios comunas entering and leaving quarantine there have been fluctuations in mobility levels.
The need to leave the house to work - during the pandemic many people in Chile have been left with the option of either leaving the house to work, or not having enough money or food to survive.
Ignorance of the quarantine - as in other countries a percentage of the population have gone outside of their homes, despite not having the need to do so.
On the 15th May total quarantine was declared in Santiago with every comuna placed in quarantine as there had been an increase in cases. From the 15th May until the last week of June it seemed that the quarantine had an effect with the mobility reducing to between 250 - 275 However, in the final week of June the mobility increased again to between 275 - 300 and in July it has continued increasing with at least an index rating of 296 every day since the 3rd July, expect for weekends and national holidays when the mobility is lower.
These trends are worrying as with greater mobility the virus spreads more quickly. It will be interesting to see how the Covid 19 situation develops in Chile in the coming days and weeks when tonight the five comunas previously mentioned move to phase two of the deconfinement plan. With less restrictions on mobility what will the impact on cases be? Additionally, will the increase in mobility seen in July lead to an increase in cases in the coming days?
Thank you for reading this publication. More information about the data used can be downloaded here, and more information about mobility levels in Santiago during the quarantine can be read here.
ggplot(data = MI_aggregated_RM) +
  geom_rect(data = rects, aes(xmin=xstart, xmax =xend, ymin= -Inf, ymax =Inf, fill = Quarantine), alpha = 0.4) +
  geom_point(aes(x = Fecha, y = IM, color = Weekend, shape = Holidays), size =2) +
  geom_smooth(aes(x = Fecha, y = IM), method = "loess") +
  ggtitle("Mobility in Santiago") + ylab("Mobility Index") + labs(color = "") + xlab("Date")